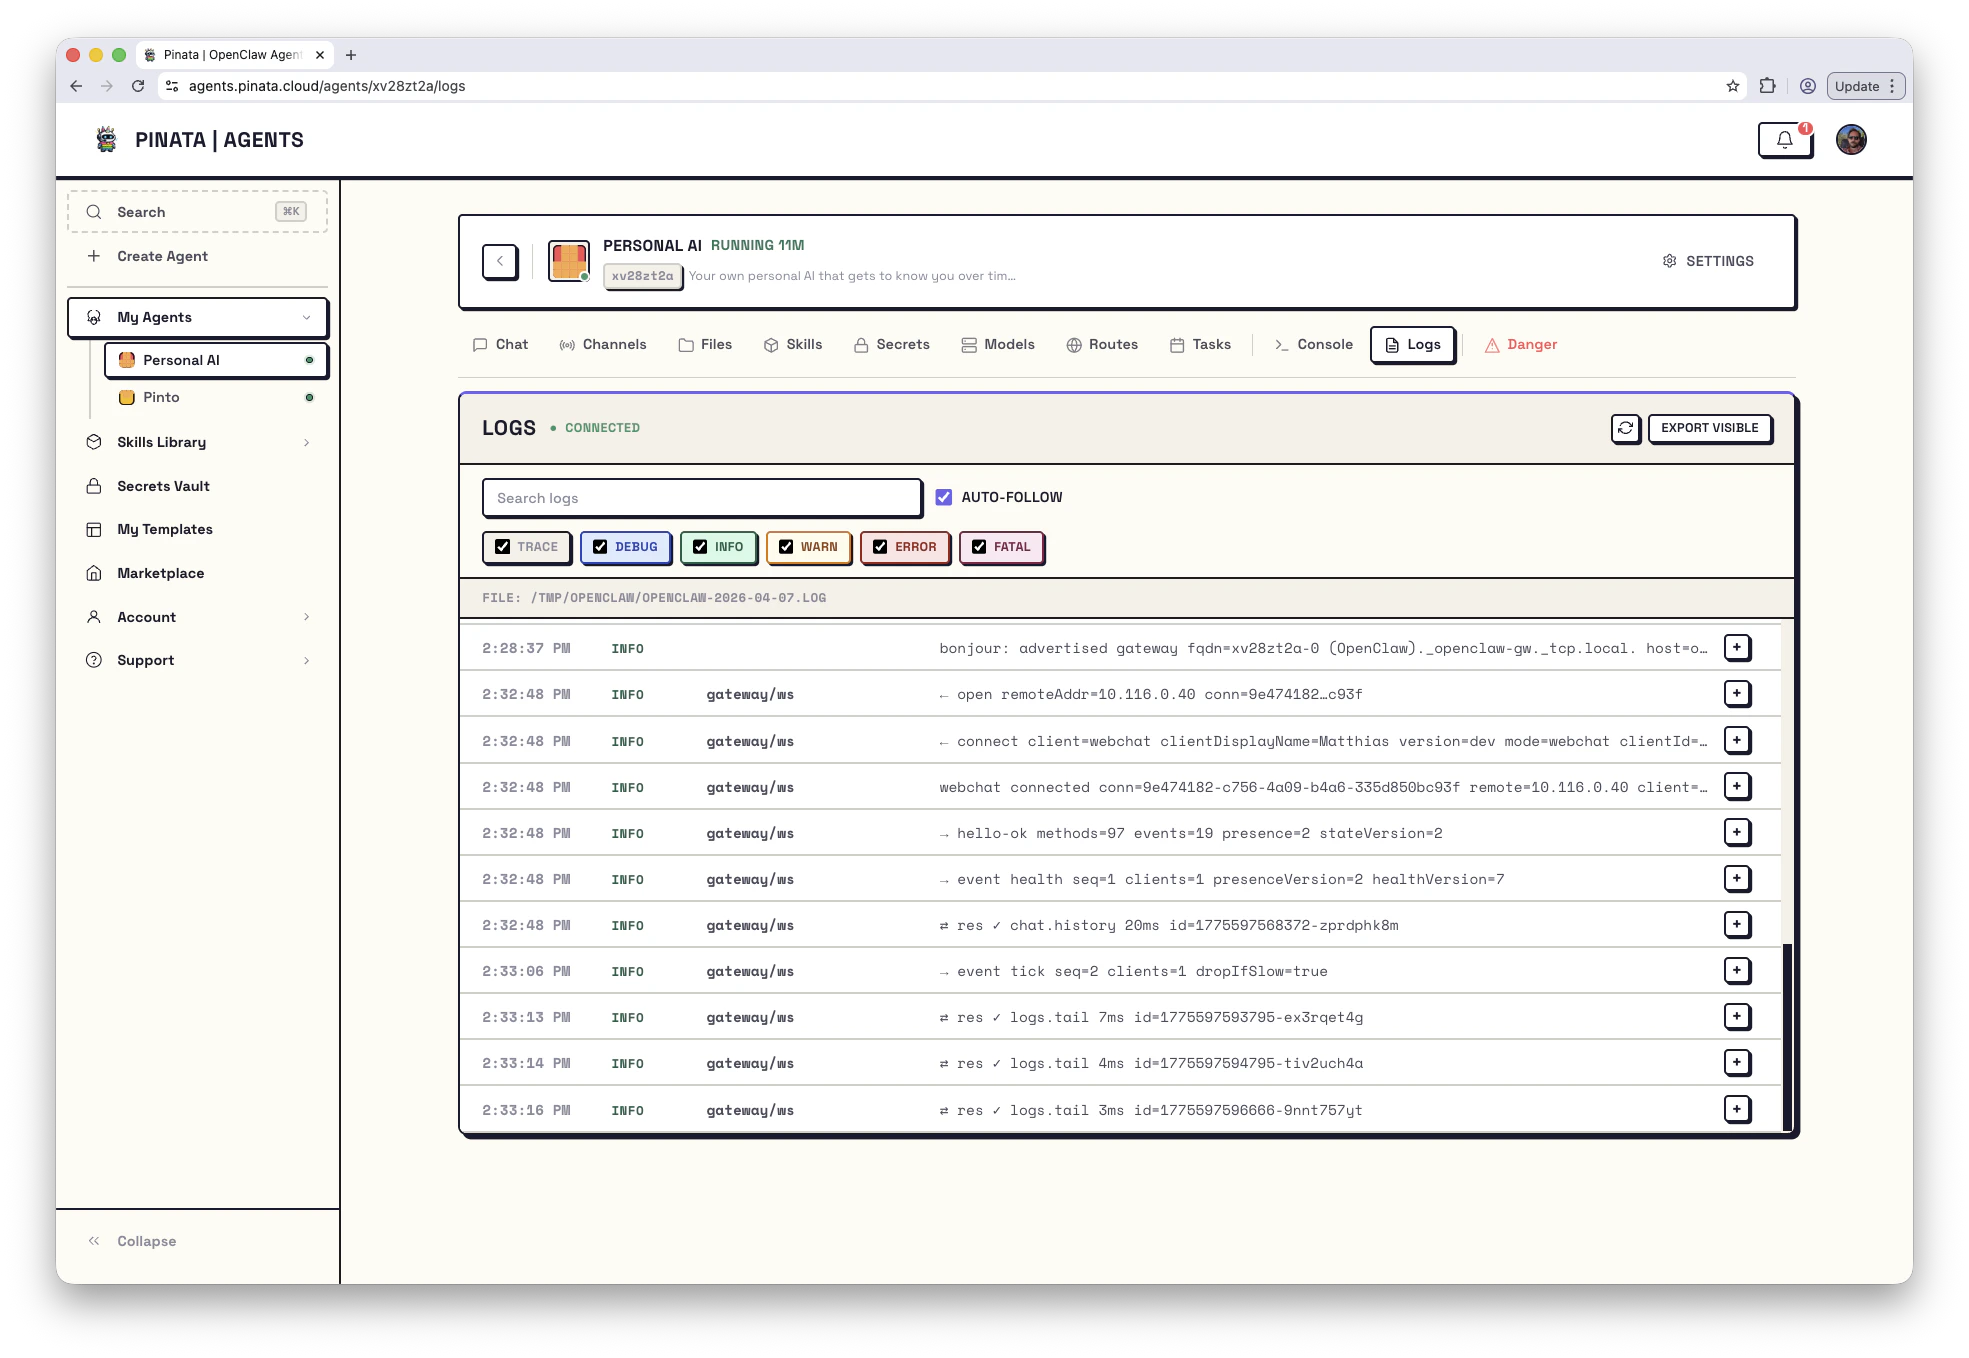
The Logs tab is a live stream of what the agent engine is doing inside your agent. New entries appear without refreshing — the tab uses a WebSocket under the hood. If the small status badge in the header reads Connected, you’re streaming. If it reads WebSocket not connected, either the agent isn’t running, the connection dropped, or there are no gateway log lines yet — hit the refresh button or check the agent’s status.Documentation Index
Fetch the complete documentation index at: https://pinata-agents-hermes-channels-schema.mintlify.app/llms.txt
Use this file to discover all available pages before exploring further.
Reading the stream
Each log line has four parts:- Timestamp — when it happened
- Level — severity (
TRACE,DEBUG,INFO,WARN,ERROR,FATAL) - Source — which component generated the line (e.g.
gateway/reload,cron/runner) - Message — the content
Filtering
The six colored checkboxes — TRACE, DEBUG, INFO, WARN, ERROR, FATAL — toggle log levels on and off. When you’re hunting a problem, uncheck everything except WARN and above to cut the noise. The Search logs box does a substring match against the message. Combine with level filters: “show me ERROR lines mentioningtelegram.”
The AUTO-FOLLOW checkbox keeps the view pinned to the latest entry. Uncheck it when you want to scroll back without the view jumping.
Exporting
EXPORT VISIBLE downloads whatever the current filters are showing — useful for sharing with support or filing an issue. It’s only what you see; the export respects your filters.Where the logs live on disk
Inside an OpenClaw container, daily log files live at/tmp/openclaw/openclaw-{date}.log. From the Console:
Reading logs over the API
For scripts and incident response:Common sources, and what they tell you
| Source | What it means |
|---|---|
gateway/reload | Gateway reloaded its configuration — usually after a secret, skill, or channel change |
gateway/ws | WebSocket lifecycle (connect, disconnect, reconnect) |
cron/runner | A scheduled task fired — which one, and what happened |
agent/turn | One conversation turn — request in, response out |
skill/<name> | Output from a specific skill |
script/build, script/start | Lifecycle script output (also tee’d to /tmp/user-build.log and /tmp/user-start.log) |